How to review analytics in Pencil Spaces?
Video: How to view analytics in Pencil Spaces
Steps to Access Recordings
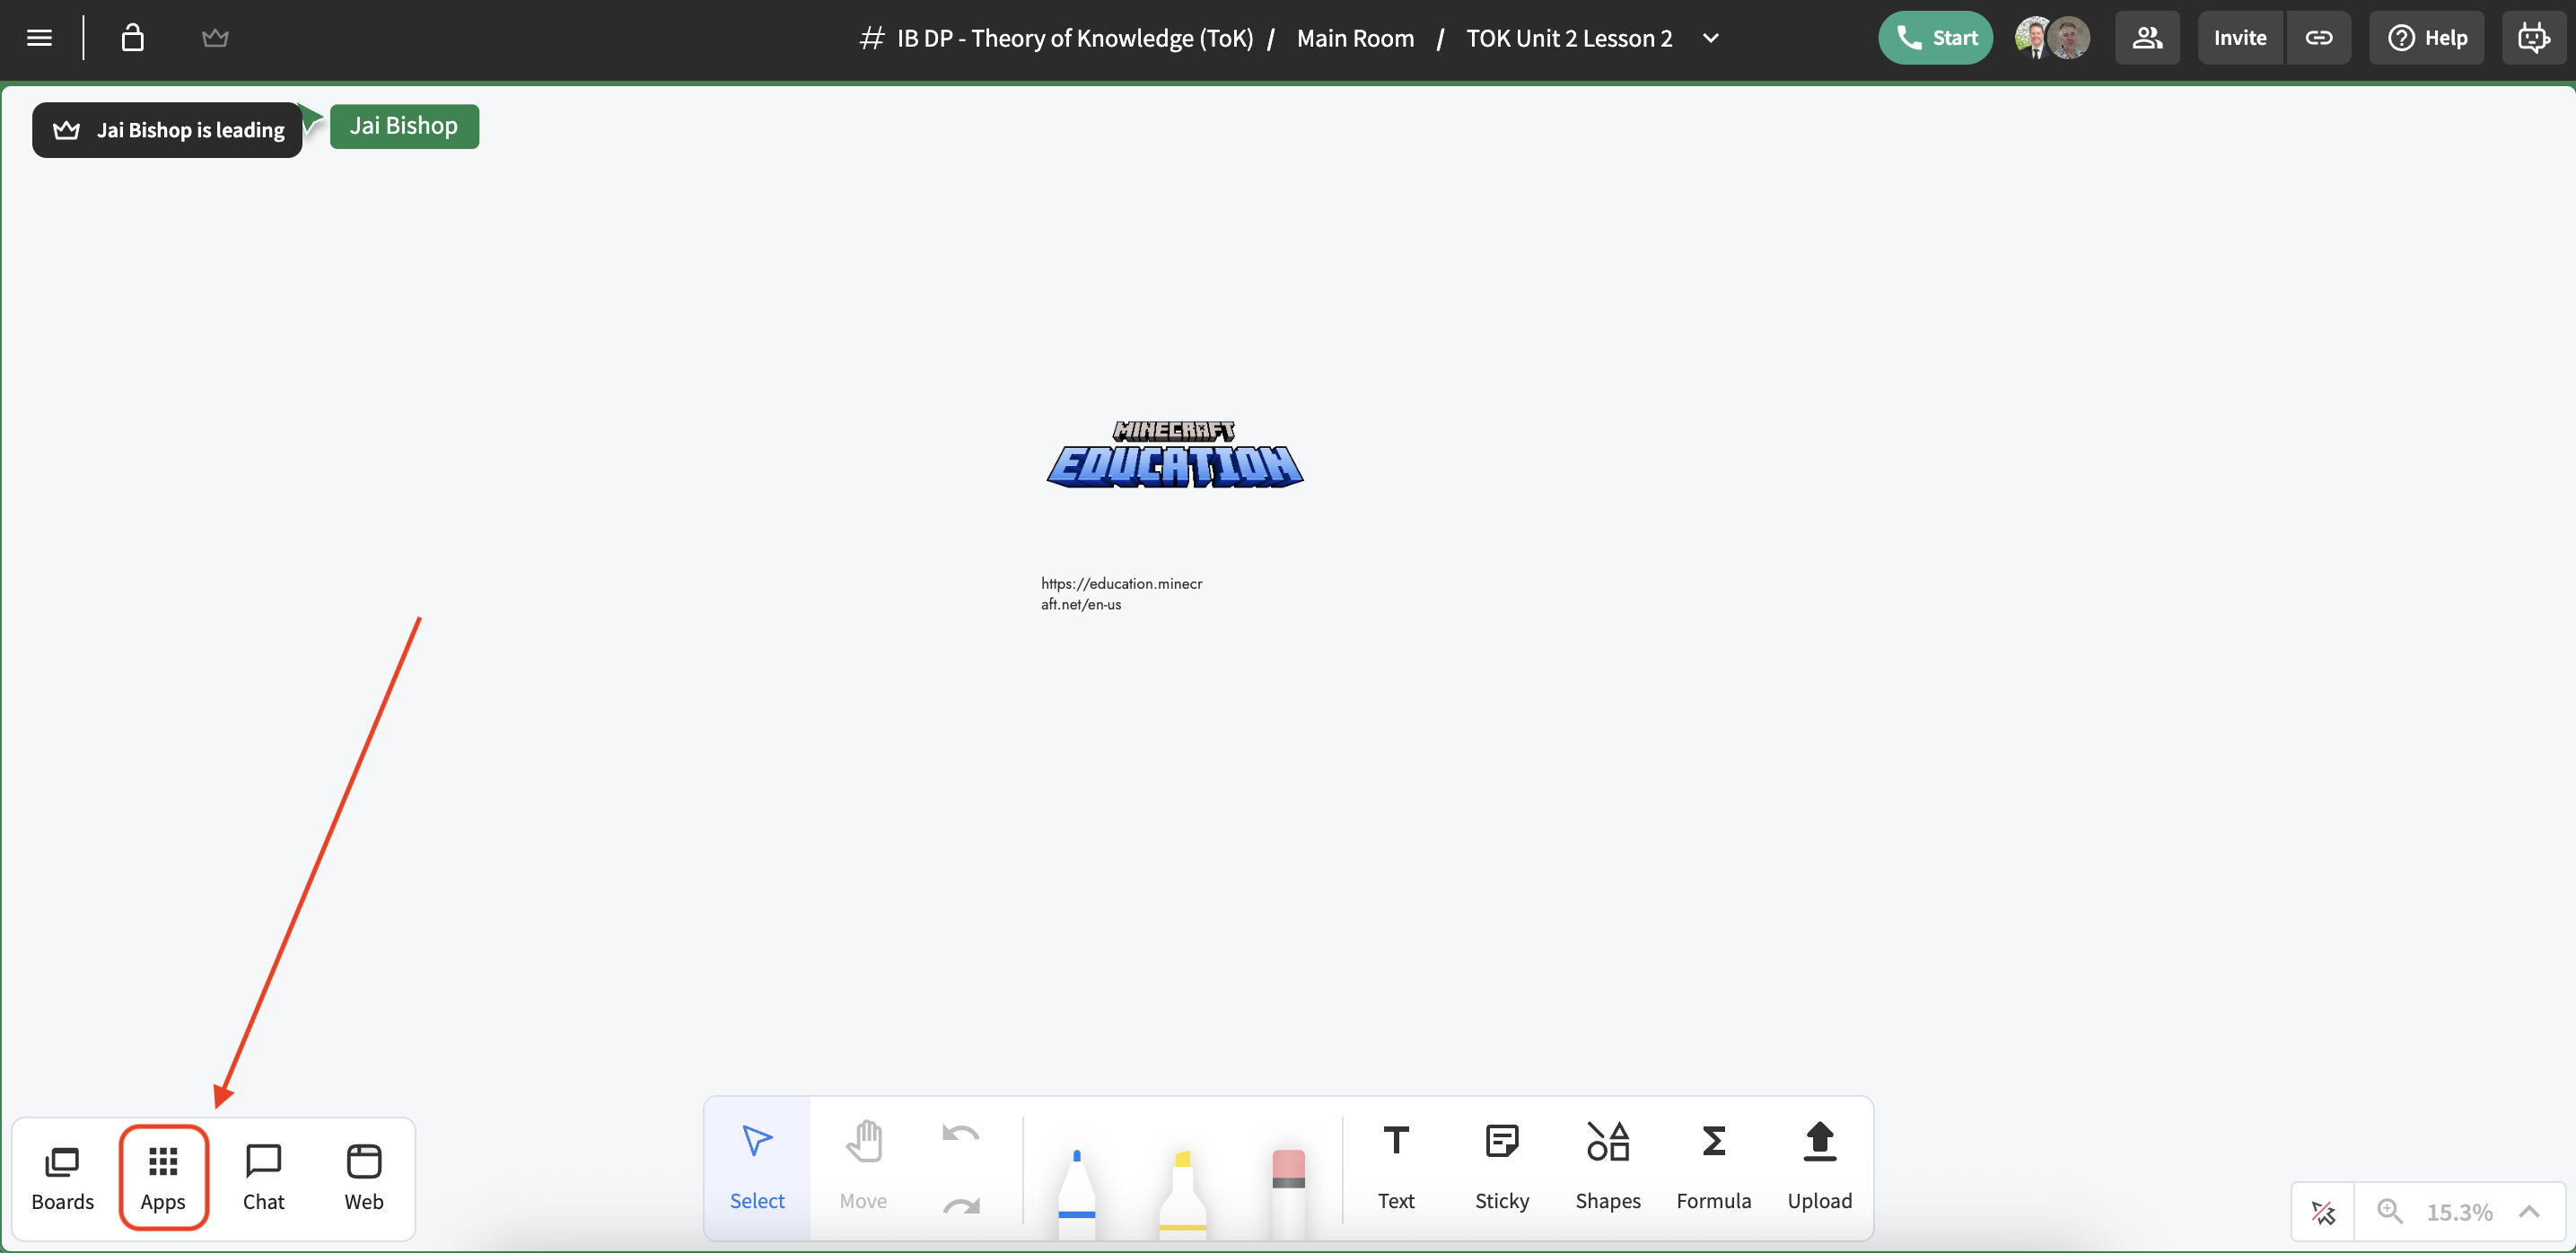
Open your Subject Space in Pencil Spaces.
Click on Apps in the top menu.
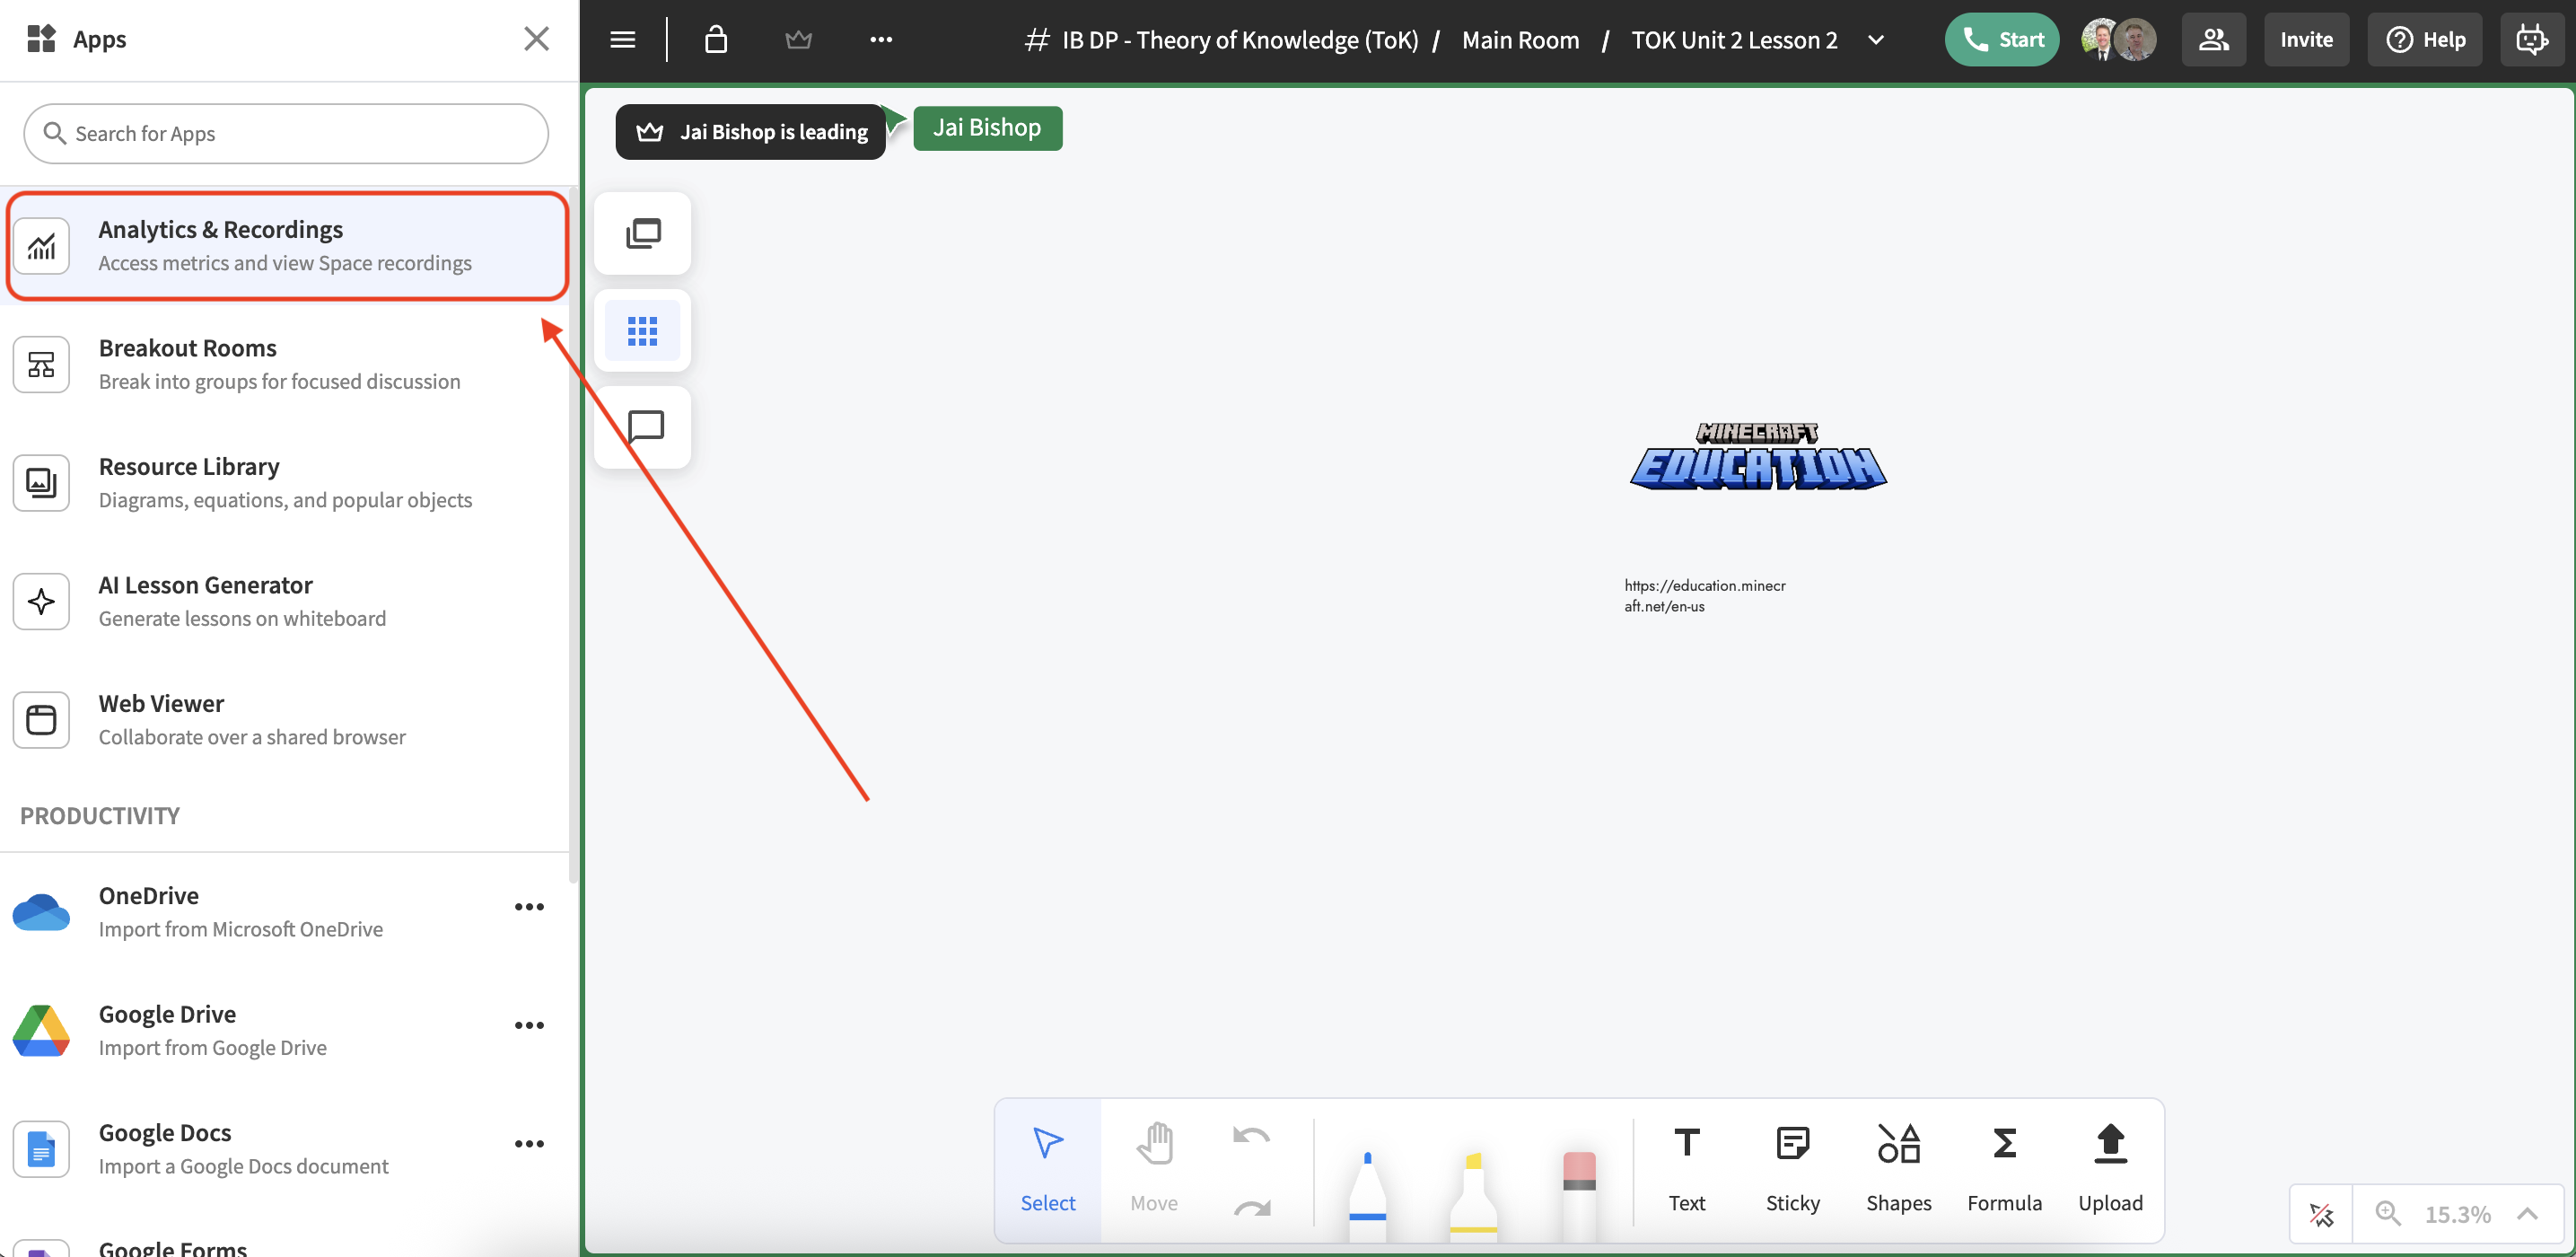
Select Analytics & Recordings.
From the left navigation, choose a past class session, then select Analytics.
From here you can view various statics about learner engagement.
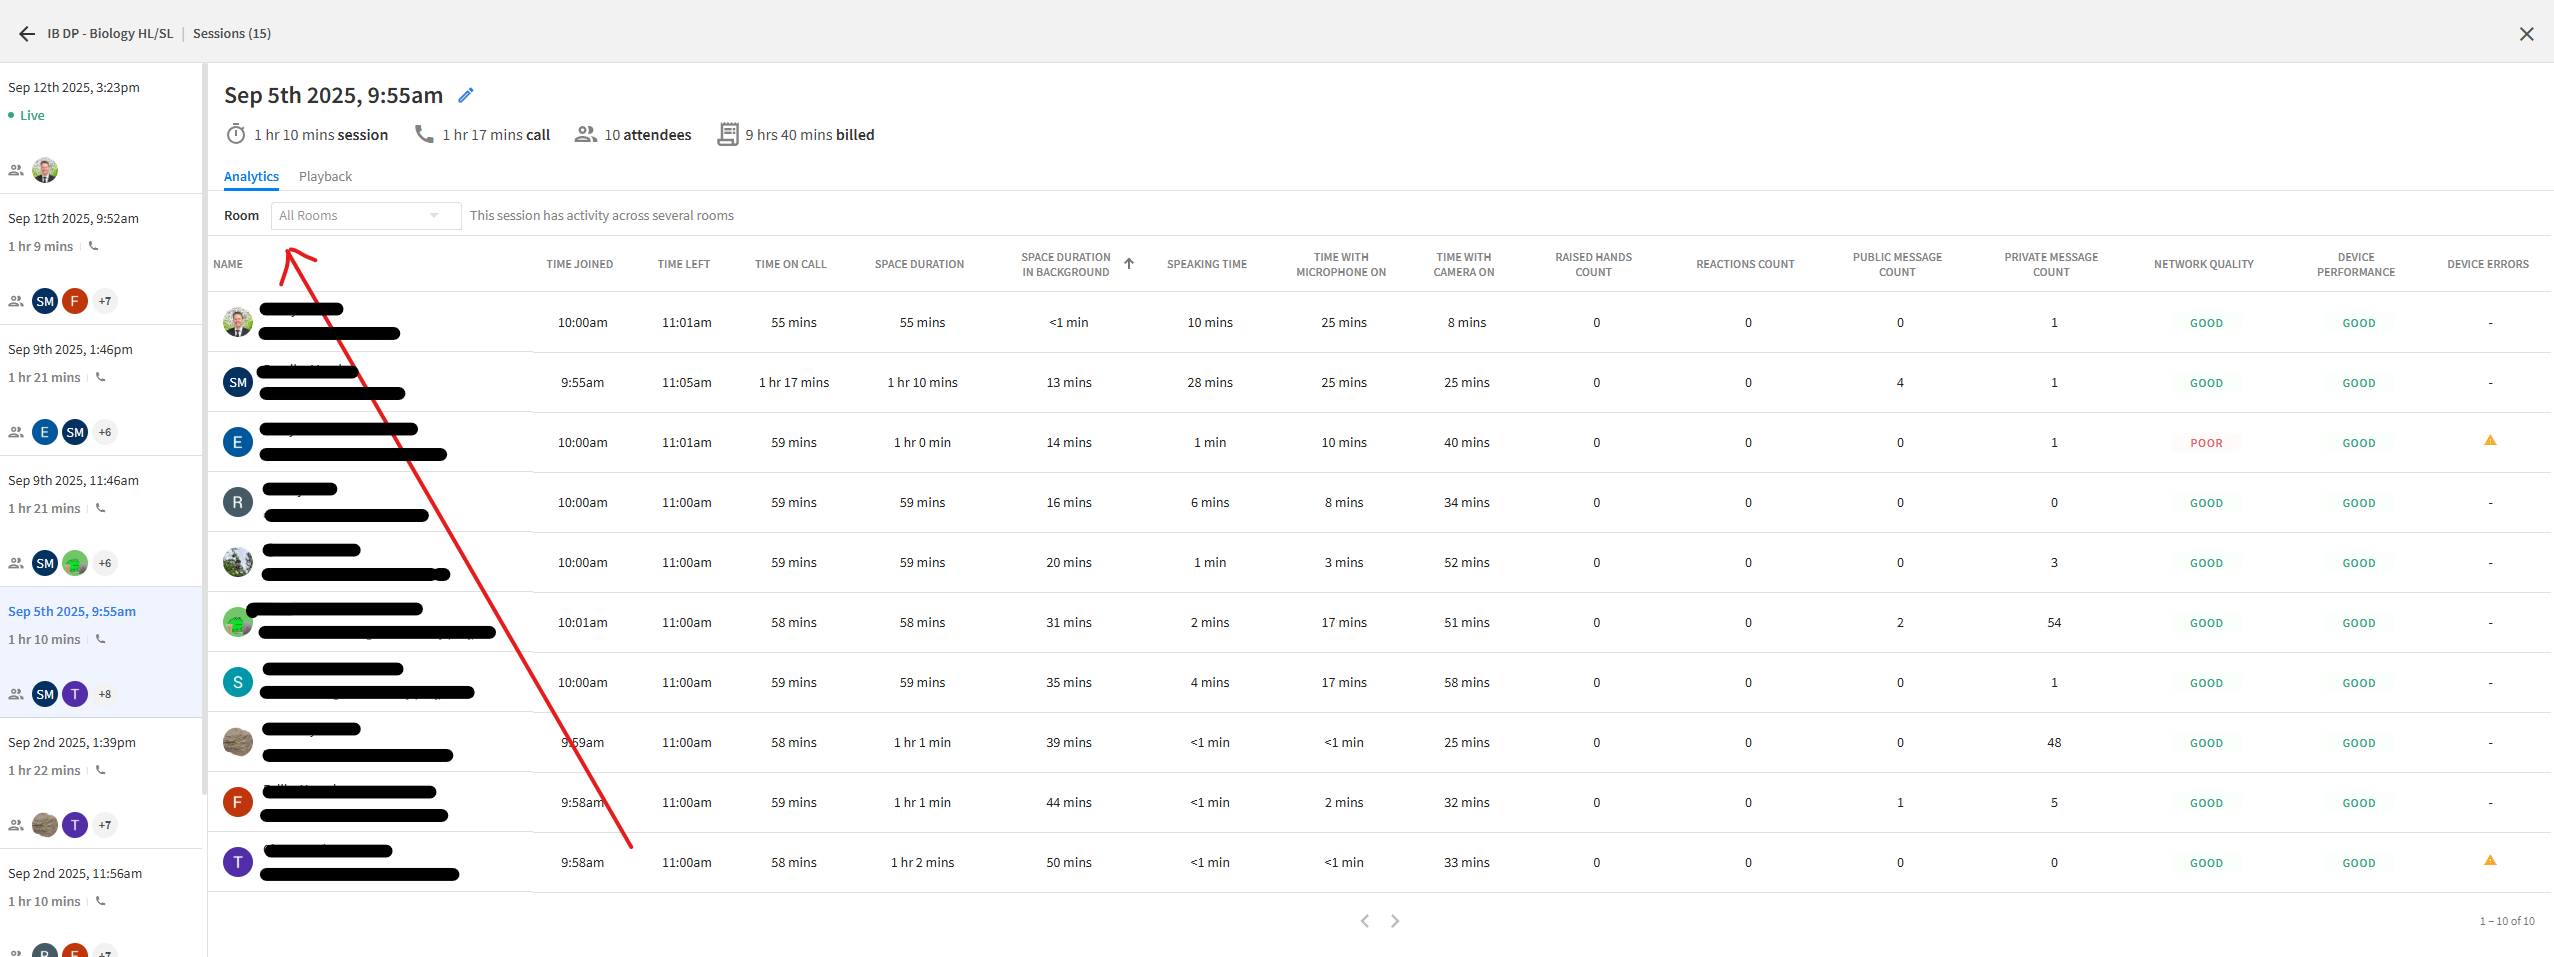
What Each Column Means
Name – Student’s name and email address.
Time Joined – When the student entered the class session.
Time Left – When the student exited the class session.
Time on Call – Total time they were actually connected with audio/video.
Space Duration – Total time spent in the Pencil Space (whether active or idle).
Space Duration in Background – Time the Pencil Space was open but minimized or in another tab/window (student working elsewhere).
Speaking Time – How long the student was actively speaking during class.
Time with Microphone On – Total time their microphone was unmuted.
Time with Camera On – Total time their camera was turned on.
Raised Hands Count – Number of times the student used the “raise hand” feature.
Reactions Count – Number of reactions (like emojis) they gave.
Public Message Count – Messages posted in the public chat.
Private Message Count – Messages sent directly to other participants.
Network Quality – Internet connection stability (e.g., Good, Poor).
Device Performance – How well their computer/device ran during the session.
Device Errors – Any technical errors detected during class.
Additional Note for Teachers
If you’d like a holistic view of a student’s participation across all classes (not just one session), you can request this from the ICT team. We can generate a broader analytics report to help identify overall patterns of engagement.